On January 30, 2026, researchers from Google Cloud AI Research and Peking University released PaperBanana, an agentic framework that automates the creation of publication-ready academic illustrations. According to the research paper, the system orchestrates specialized agents to retrieve references, plan content and style, render images, and iteratively refine via self-critique.
The significance? Academic illustration has remained a labor-intensive bottleneck in the research workflow even as AI scientists now handle literature reviews, hypothesis generation, and code. Creating diagrams that meet publication standards requires specialized design skills most researchers lack—and takes hours per figure.
As per recent research, PaperBananachanges this by achieving a 72.7% win rate against baseline AI models in blind human evaluation, with improvements across faithfulness (+2.8%), conciseness (+37.2%), readability (+12.9%), and aesthetics (+6.6%).
At Dextra Labs, we help enterprises, research teams, and SMEs across the UAE, USA, and Singapore implement AI-powered workflows for content production, documentation, and knowledge management. PaperBanana represents a significant advance in agentic AI, not just for academic researchers, but for any organization creating technical documentation, methodology diagrams, or data visualizations.
This analysis examines how PaperBanana works, when to use it, and what it means for the future of automated technical illustration.
Also Read: From LLM Embeddings to Business Impact: Advanced Feature Engineering
The Academic Illustration Problem
Before diving into PaperBanana’s architecture, understand the problem it solves.
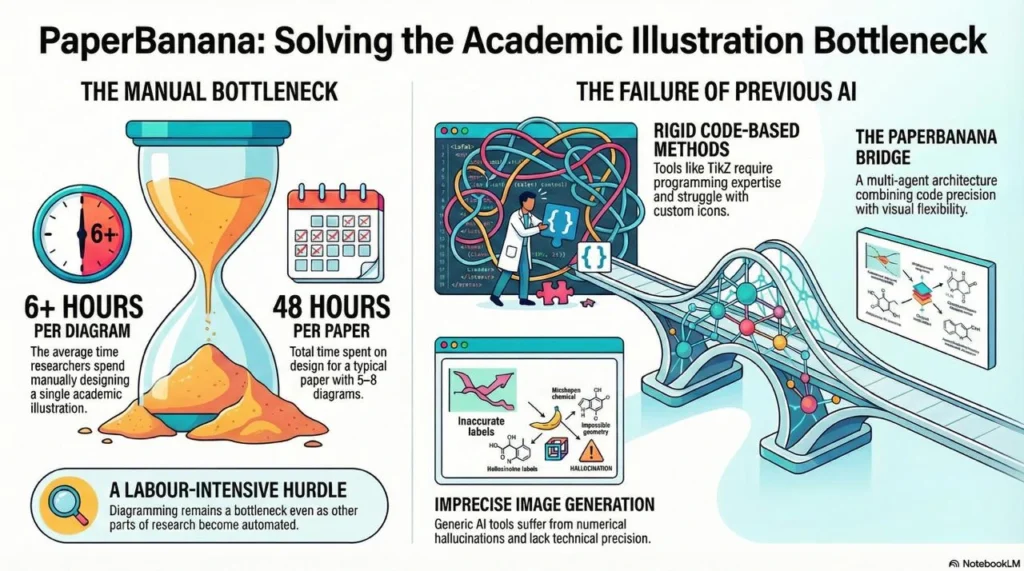
The Manual Bottleneck
Academic researchers spend 6+ hours per diagram on average, using tools like Adobe Illustrator, PowerPoint, or specialized LaTeX packages like TikZ. According to the research team, despite rapid advances in autonomous AI scientists powered by language models, generating publication-ready illustrations remains a labor-intensive bottleneck.
For a typical computer science paper with 5-8 methodology diagrams, that’s 30-48 hours of design work time that could be spent on actual research.
Why Previous AI Approaches Failed?
Earlier attempts at automated diagram generation fell into two camps:
Code-Based Methods (TikZ, Python-PPTX):
- Require programming expertise
- Struggle with complex visual elements
- Can’t handle specialized icons or custom shapes
- Produce rigid, template-bound outputs
Pure Image Generation (DALL-E, Imagen):
- Generate aesthetically pleasing images
- Suffer from “numerical hallucinations” in plots
- Lack precision in technical details
- Don’t conform to academic publication standards
PaperBanana bridges this gap through a multi-agent architecture that combines the precision of code with the flexibility of visual generation.
The Five-Agent Architecture
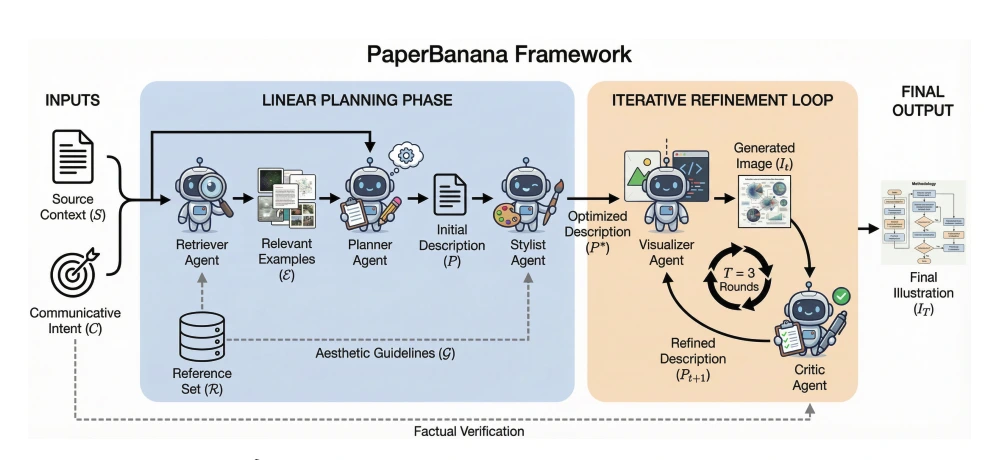
PaperBanana doesn’t rely on a single prompt. According to the research paper, it “orchestrates specialized agents” in a coordinated workflow. Here’s how each agent contributes:
Agent 1: Retriever
Function: Identifies the 10 most relevant reference examples from a curated database
How It Works: The Retriever searches through 292 methodology diagrams from NeurIPS 2025 publications, finding examples that match the domain, style, and complexity of the requested diagram.
Why It Matters: Reference retrieval grounds the generation in real publication standards rather than generating arbitrary visuals.
Agent 2: Planner
Function: Translates technical methodology text into a detailed textual description of the target figure
How It Works: Takes the raw method description and creates a structured plan specifying:
- Components to include
- Relationships between elements
- Information hierarchy
- Layout considerations
Why It Matters: This intermediate representation ensures the final visualization accurately reflects the methodology’s logic.
Agent 3: Stylist
Function: Applies color, typography, iconography, and layout principles learned from academic publications
How It Works: The Stylist enforces aesthetic guidelines automatically extracted from the PaperBananaBench dataset, including:
- Color palettes (favoring “Soft Tech Pastels” over harsh primary colors)
- Typography conventions
- Icon styles
- Layout patterns
Why It Matters: Consistency with publication standards increases acceptance rates and reduces reviewer friction.
Agent 4: Visualizer
Function: Generates the diagram or emits executable code for statistical plots
How It Works: For methodology diagrams, use Nano-Banana-Pro (an image generation model). For statistical plots, writes Python code using Matplotlib/Seaborn instead of generating images directly.
Why It Matters: The hybrid approach ensures numerical precision for data plots while maintaining aesthetic quality for conceptual diagrams.
Agent 5: Critic
Function: Scores outputs and triggers refinement
How It Works: Evaluates generated diagrams across four dimensions:
- Faithfulness: Does it accurately represent the methodology?
- Conciseness: Is information presented efficiently?
- Readability: Can readers understand it quickly?
- Aesthetics: Does it meet publication standards?
The Critic can trigger up to three refinement iterations, with each cycle improving the output.
Also Read: 10 NotebookLM Super Prompts For Pro-Level Productivity
The Two-Phase Generation Process
PaperBanana operates in two distinct phases based on the type of illustration:
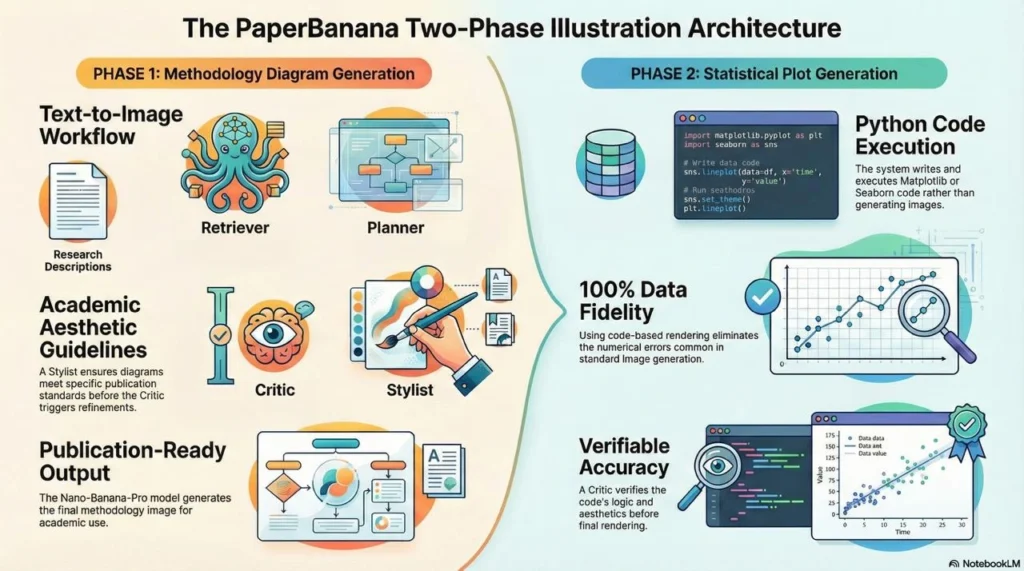
Phase 1: Methodology Diagrams (Image Generation)
Input: Text description of research methodology
Process:
- Retriever finds reference examples
- Planner creates detailed description
- Stylist applies academic aesthetic guidelines
- Visualizer generates image via Nano-Banana-Pro
- Critic evaluates and triggers refinements
Output: Publication-ready methodology diagram
Phase 2: Statistical Plots (Code Generation)
Input: Data and description of desired plot
Process:
- Planner determines plot type and structure
- Visualizer writes executable Python code instead of generating images
- Critic verifies code accuracy and aesthetics
- Code executes to produce final plot
Output: Matplotlib/Seaborn code + rendered visualization
According to the research team, this approach ensures 100% data fidelity by using the Matplotlib library to render the final plot rather than relying on image generation, which often produces numerical errors.
Also Read: Is Kimi K2.5 the BEST Open-Source Model of 2026?
Benchmark Performance: PaperBananaBench
To rigorously evaluate PaperBanana, the research team created PaperBananaBench: 292 test cases curated from NeurIPS 2025 publications, covering diverse research domains and illustration styles.
Evaluation Methodology
The team used a “VLM-as-a-Judge” approach, where a vision-language model evaluates diagram quality across four dimensions:
- Faithfulness: Accuracy of content representation
- Conciseness: Efficiency of information presentation
- Readability: Clarity and understandability
- Aesthetics: Visual appeal and professionalism
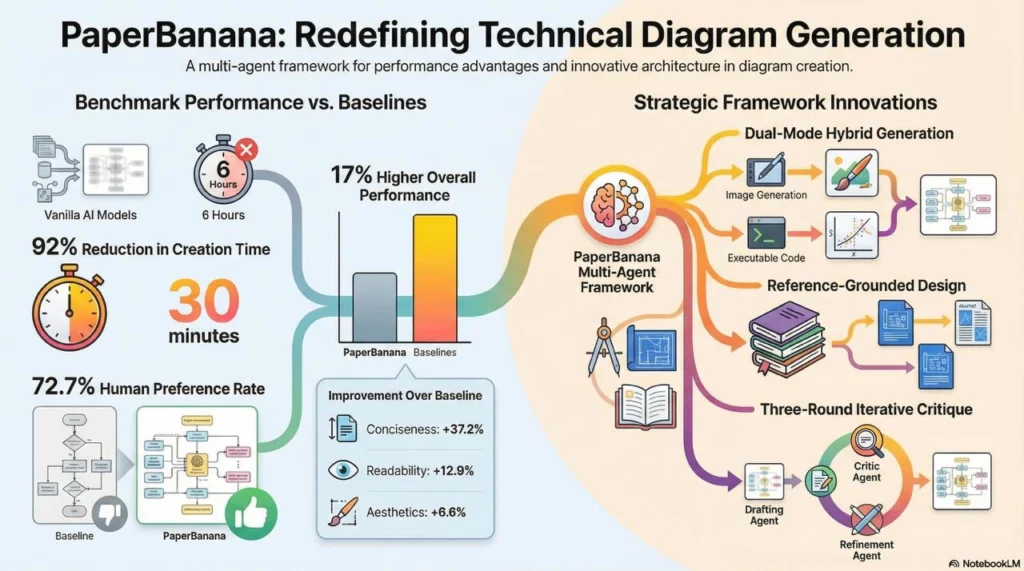
Results vs. Baselines
PaperBanana demonstrated consistent superiority over vanilla baselines:
- Overall Score: +17.0%
- Faithfulness: +2.8%
- Conciseness: +37.2%
- Readability: +12.9%
- Aesthetics: +6.6%
In blind human evaluation, reviewers preferred PaperBanana’s diagrams in 72.7% of cases compared to baseline image generation.
Domain-Specific Performance
PaperBanana excels particularly in “Agent & Reasoning” diagrams, achieving a 69.9% overall score. This makes sense given the framework’s own multi-agent architecture—it understands agent systems because it is an agent system.
Also Read:- Recursive Language Models (RLMs): Scaling LLM Reasoning Beyond Context Limits
What Makes PaperBanana Different from General AI Image Generation?
1. Reference-Grounded Generation
Unlike general image generators that work from scratch, PaperBanana grounds every diagram in real publication examples. This ensures outputs conform to academic conventions rather than generic “pretty pictures.”
2. Dual-Mode Generation (Images + Code)
For methodology diagrams, PaperBanana uses image generation for aesthetic flexibility. For statistical plots, it generates executable code to ensure numerical precision. This hybrid approach addresses the fundamental weakness of pure image models: numerical hallucinations.
3. Iterative Self-Critique
The Critic agent’s three-round refinement process mirrors human design iteration. Initial outputs undergo systematic improvement rather than one-shot generation.
4. Domain-Adaptive Styling
The research paper notes that aesthetic choices often shift based on the research domain to match the expectations of different scholarly communities. PaperBanana automatically adapts style to match domain conventions.
Practical Applications Beyond Academia
While designed for academic researchers, PaperBanana’s capabilities extend to any domain requiring technical diagrams:
Enterprise Use Cases
Technical Documentation: Generate methodology diagrams for internal systems, APIs, and architectures
Product Specifications: Create visual representations of product workflows and user journeys
Data Reporting: Automate statistical plot generation for quarterly reports and dashboards
Training Materials: Produce instructional diagrams for onboarding and knowledge transfer
Patent Applications: Generate methodology diagrams for patent documentation
Time and Cost Savings
If PaperBanana reduces diagram creation from 6 hours to 30 minutes, that’s a 92% time reduction. For a typical CS researcher producing 20 diagrams annually, that’s 100-200 hours saved per year.
For enterprises producing technical documentation at scale, the savings compound dramatically.
Also Read: Top 5 Agentic Coding CLI Tools That Actually Ship Code
Limitations and Considerations
Despite impressive capabilities, PaperBanana has acknowledged limitations:
1. Raster Output, Not Vector
The system outputs raster images (pixels) rather than vector graphics (scalable paths). This means:
- Limited editability after generation
- Potential quality loss when scaling
- Can’t easily adjust individual elements
The research team suggests generating 4K resolution images as a workaround for print quality, or using image processing models for minor tweaks post-generation. The most ambitious future direction: “an AI agent that operates vector software like Adobe Illustrator on its own”.
2. Content Accuracy Challenges
While aesthetics are strong, the system achieves only 45.8% content fidelity according to The Decoder’s analysis. This manifests as:
- Misaligned connecting lines and arrows
- Incorrect relationships between components
- Missing or duplicated elements
This means PaperBanana works best with human review rather than fully autonomous deployment.
3. Computational Cost
Running five specialized agents through multiple refinement iterations requires significant computation. For production deployments, this means:
- Higher API costs than single-model generation
- Longer generation times (though still faster than manual design)
- Need for result caching to avoid redundant generation
The Future of Automated Technical Illustration
PaperBanana points toward several trends in AI-powered content production:
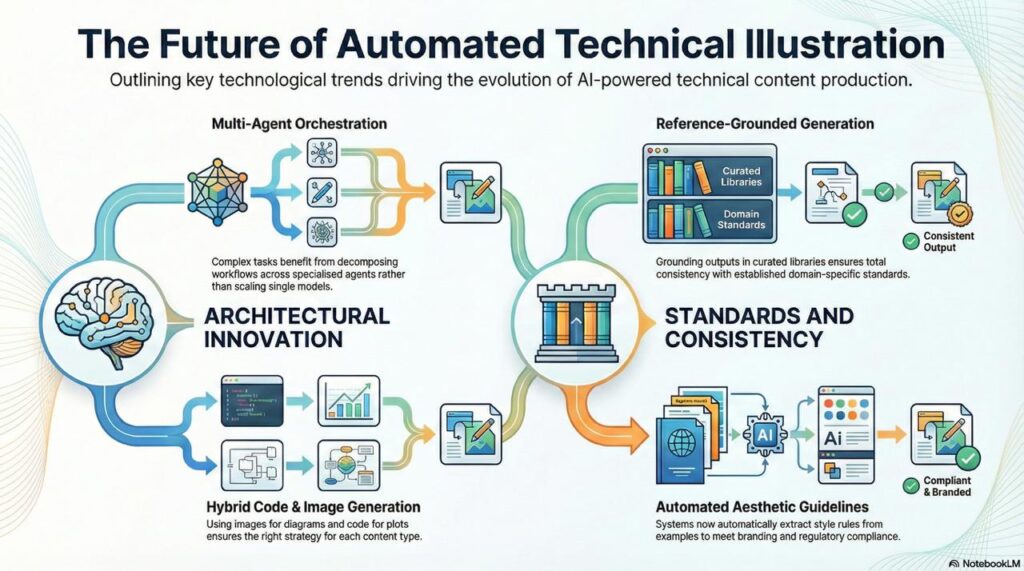
1. Multi-Agent Becomes Standard
Single-model generation is giving way to specialized agent orchestration. PaperBanana’s five-agent architecture demonstrates that complexity benefits from decomposition rather than scaling a single model.
2. Hybrid Code + Image Generation
The dual-mode approach (images for diagrams, code for plots) will likely become standard. Different content types demand different generation strategies.
3. Reference-Grounded Generation
Rather than generating from scratch, future systems will ground outputs in curated reference libraries—ensuring consistency with domain standards.
4. Automated Aesthetic Guidelines
PaperBanana automatically extracts style rules from example sets. This capability will expand to other domains: corporate branding, publication styles, regulatory compliance.
Getting Started with PaperBanana
The research team launched a commercial service simultaneously with the arXiv publication. According to project documentation:
Official Website: paperbanana.org
Project Page: dwzhu-pku.github.io/PaperBanana/
Unofficial Open-Source Implementation: github.com/llmsresearch/paperbanana
Pricing (as reported): Monthly subscription plans from $14.90 to $119.90 offering 10 to 250 credits for diagram generation.
Recommended Workflow
Based on the research team’s suggestions:
1. Start with a single methodology section you’ve already written
2. Use clear component names and relationships
3. Generate one diagram and one plot
4. Check faithfulness first, then iterate for layout and typography
5. Generate multiple variations and select the best
6. Establish style guidelines for consistency across projects
Conclusion: The Last Manual Bottleneck
According to the research paper, AI systems now help with literature research, brainstorming, and running experiments, but visual presentation still takes significant manual effort. PaperBananaaddresses this final bottleneck.
The system’s 72.7% win rate in human evaluation and 17% overall score improvement demonstrate that agentic frameworks can match or exceed human design work—at least for standardized technical diagrams.
But PaperBanana’s real contribution isn’t replacing designers. It’s democratizing access to publication-quality illustration. Researchers without design skills or budget can now produce professional diagrams. Small teams can compete visually with well-resourced labs. Technical documentation can include rich visuals without dedicated design resources.
At Dextra Labs, we help enterprises, research teams, and SMEs across the UAE, USA, and Singapore implement AI-powered content workflows that include automated diagram generation, data visualization, and technical illustration. Whether you’re producing academic papers, technical documentation, or product specifications, agentic frameworks like PaperBanana are changing what’s possible.
The question isn’t whether to automate technical illustration, it’s how to integrate automation while maintaining quality, brand consistency, and domain appropriateness.
FAQs:
Q. Can PaperBanana really replace manual diagram design?
Short answer: not entirely and it shouldn’t. PaperBanana dramatically reduces the time required to create publication-ready diagrams, but it still benefits from human review. Think of it as a highly capable research assistant that gets you 80–90% of the way there. You still validate relationships, fix small alignment issues, and ensure domain accuracy before submission.
For most users, it replaces tedious design work not human judgment.
Q. Is PaperBanana only useful for academic researchers?
Not at all. While it was trained on academic methodology diagrams (like those from NeurIPS), the core architecture applies to:
– Technical documentation
– Product architecture diagrams
– Workflow visualizations
– API or system documentation
– Data reporting charts
At Dextralabs, we see strong potential for enterprises producing technical content at scale, especially engineering, product, and AI teams.
Q. How accurate are the generated statistical plots?
For statistical plots, PaperBanana uses executable Python code (Matplotlib/Seaborn) instead of pure image generation. That significantly reduces the risk of “numerical hallucination.”
However, you should still:
– Verify axis labels
– Confirm dataset inputs
– Validate statistical assumptions
It’s far more reliable than generative image-only tools, but validation remains best practice.
Q. Does PaperBanana eliminate the need for designers?
Not exactly, it changes how they work. Instead of manually building every diagram from scratch, designers can:
– Review AI-generated drafts
– Focus on higher-level visual consistency
– Apply branding
– Fine-tune for publication standards
It democratizes technical illustration rather than removing design expertise.
Q. How complex is it to integrate PaperBanana into enterprise workflows?
Out of the box, PaperBanana works as a service for generating diagrams. But in enterprise settings, integration means:
– Defining style guidelines
– Connecting to documentation systems
– Implementing human review checkpoints
– Ensuring brand and compliance alignment
At Dextralabs, we help organizations implement these agentic frameworks within existing content pipelines so automation adds value, not chaos.
Q. When should we not rely on PaperBanana?
You should avoid fully automated generation when:
Diagrams require highly novel, unconventional layouts
Legal or regulatory submissions need exact, manually controlled layouts
Extremely high-stakes publications demand pixel-level perfection
In those cases, use it as a starting point rather than a final output.